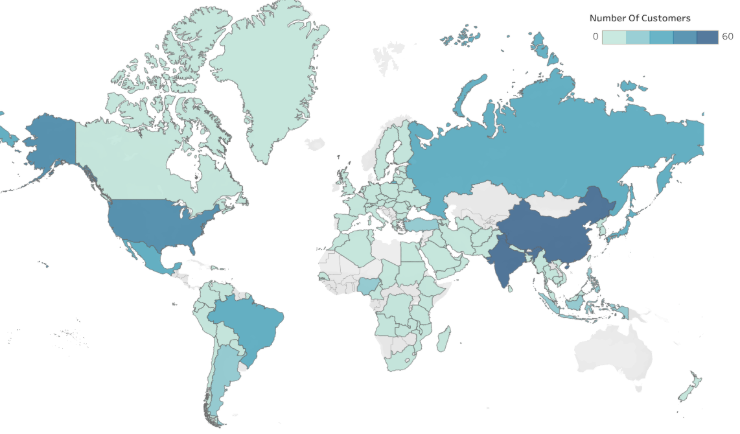
Customers Distribution Map
Motivation
Rockbuster Stealth LLC is a fictional movie rental company that used to have stores around the world. Facing stiff competition from streaming services, the Rockbuster Stealth management team is planning to use its existing movie licenses to launch an online video rental service to stay competitive.
Objective
Extract key insights from RockBuster’s operational database to help with the launch strategy for the new online video service.
RockBuster Stealth LLC management had some questions that wanted answers for:
Besides these, and after some exploratory data analysis, I raised a set of extra questions:
Rockbuster provided the Dataset with their operational data.
Therefore, with exception to sourcing data, I developed a full life cycle of data analysis,
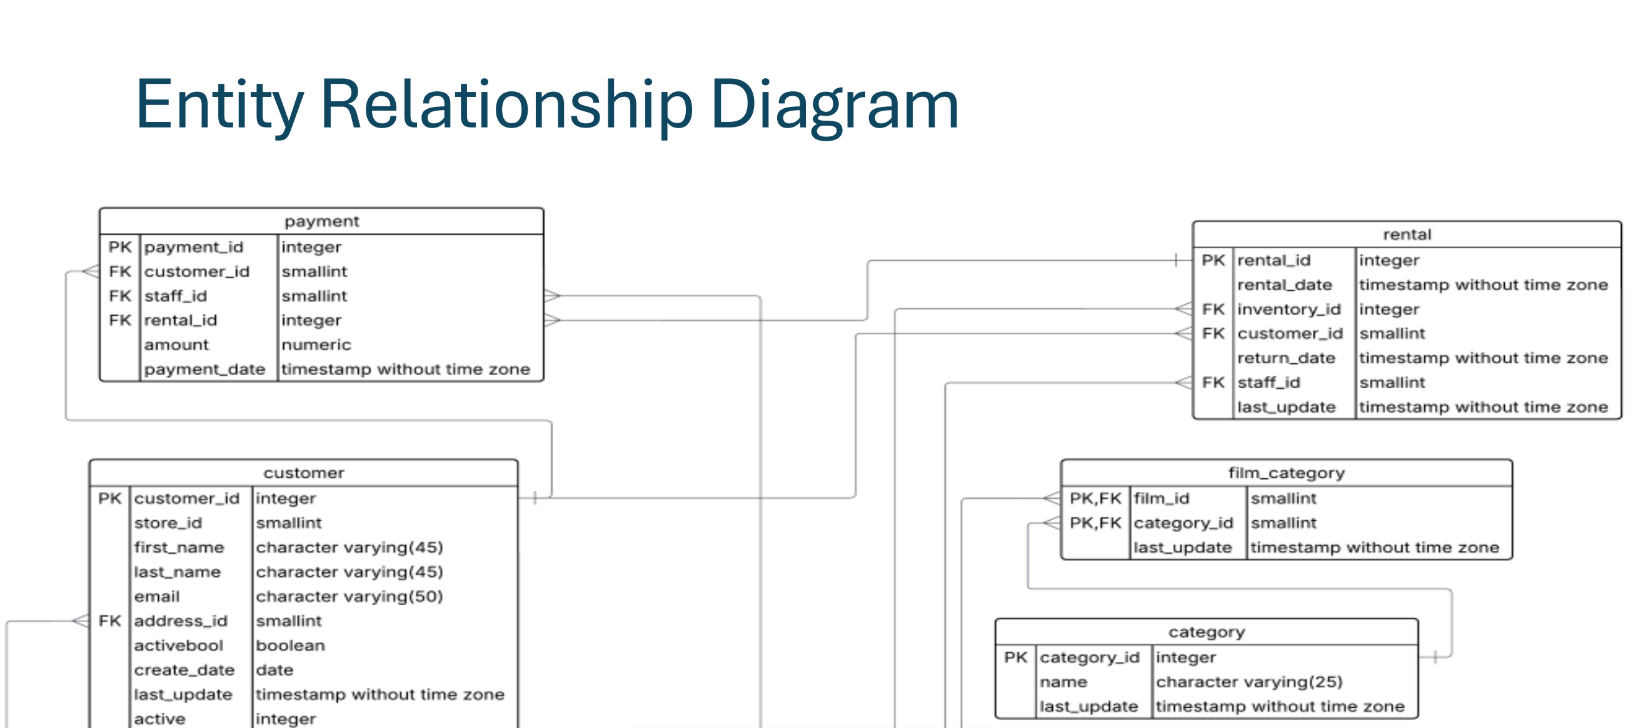
from data cleaning to final presentation to stakeholders, including documenting the database itself,
producing a data dictionary.
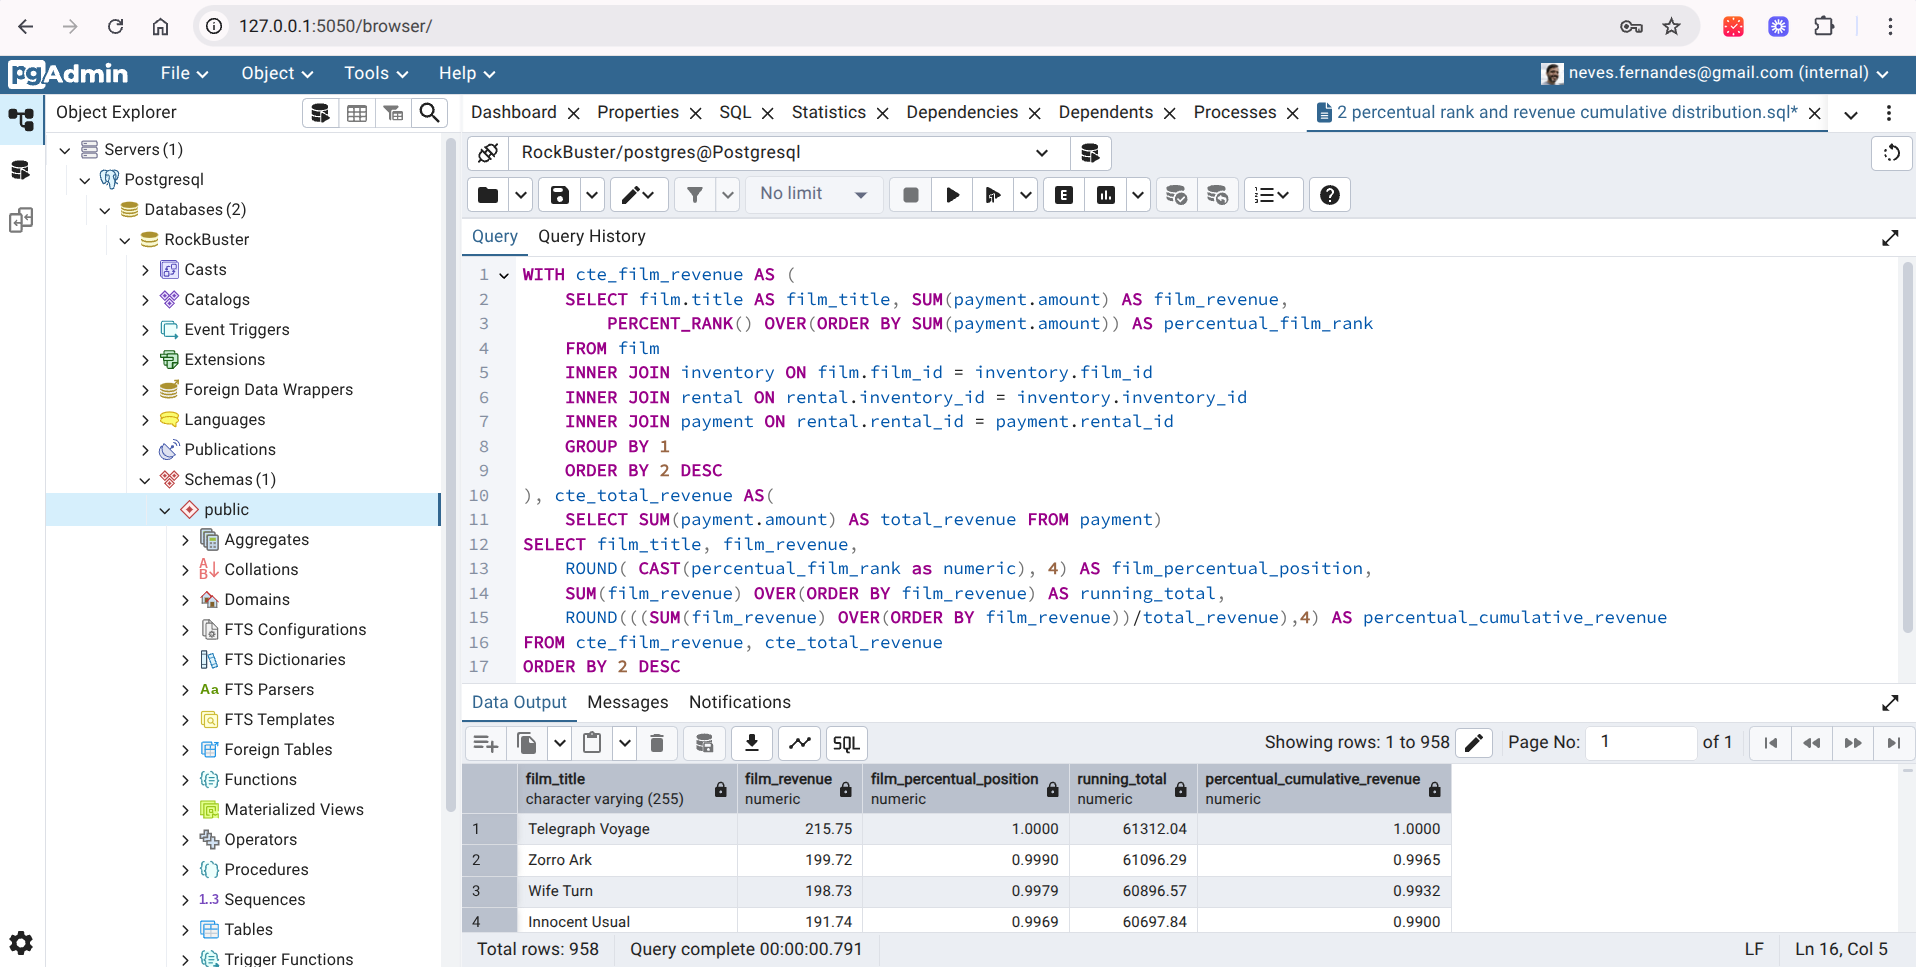
Using SQL for this process, I started from scratch installing Postrgesql - a relational database management system -
and pgadmin4 which acts as user interface to deal with the database itself.
There, I made all actions related with cleaning and summarizing data,
and on a later stage developed the queries that were needed to answer the relevant business questions,
using techniques such as table joins, subqueries, common table expressions and window functions.
All the queries and corresponding outputs were compiled in an excel file, to be shared with technical peers.
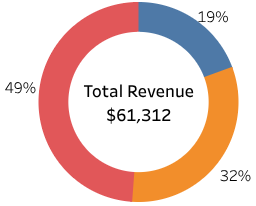
 On the left it's shown the revenue distribution for each of the rental rates defined in the catalog.
Rate in this context is simply the price at which the films are rented for the agreed rental duration.
Since the number of rentals on each rate are well balanced, the average revenue per rental follows a very similar distribution.
But the immediate question was:
With a similar number of rentals, shouldn’t a rate of $4.99 produce a revenue approximately 5 times higher than $0.99?
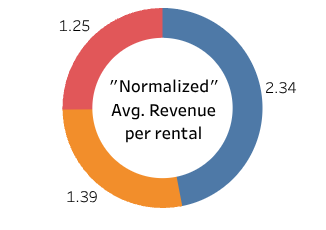 In fact, if we normalize the average revenue per rental, i.e., if we divide the average revenue per rental by the value of the rental rate itself,
we can quickly see that 0.99$ is the one that performs better.
In fact, if we normalize the average revenue per rental, i.e., if we divide the average revenue per rental by the value of the rental rate itself,
we can quickly see that 0.99$ is the one that performs better.
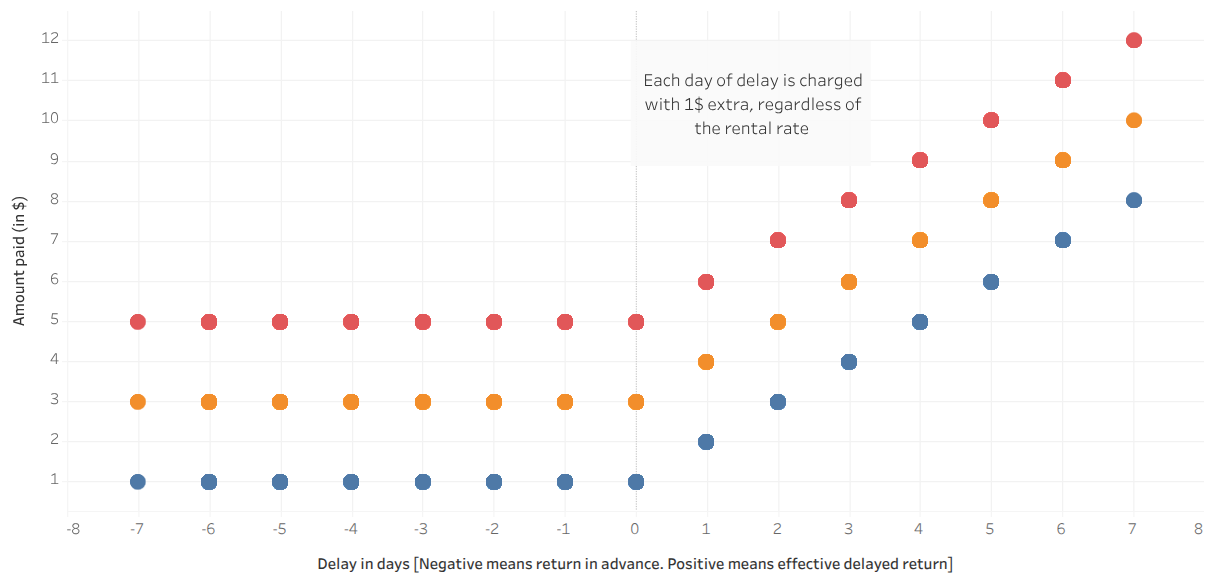
But why does this happen?
The secret lies in the penalty policy. The customers keep their films in completely different patterns from what would be expectable just by looking at what is defined in the catalog, and they incur in penalties in case of delays. Looking deeper into the data, I’ve discovered that the penalties are a fixed amount (1$) per day of delay, which in turn influences more the lowest rental rate.
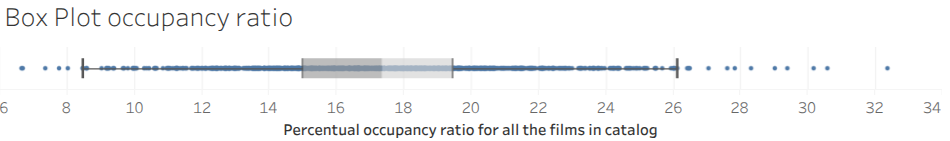
Another metric developed was the Occupancy Ratio. It was measured the timespan between the first rental date and the last return date on the database, serving as the denominator for the ratio (100% of time). Then, I measured for each existing copy of the films, how much time they were effectively on rental (or on the other hand they were catching dust in our stores shelves). Finally, I've computed an average time of the several copies of each film. The division of the latter by the denominator gave us the film's Occupancy Ratio.
Customers Distribution Map
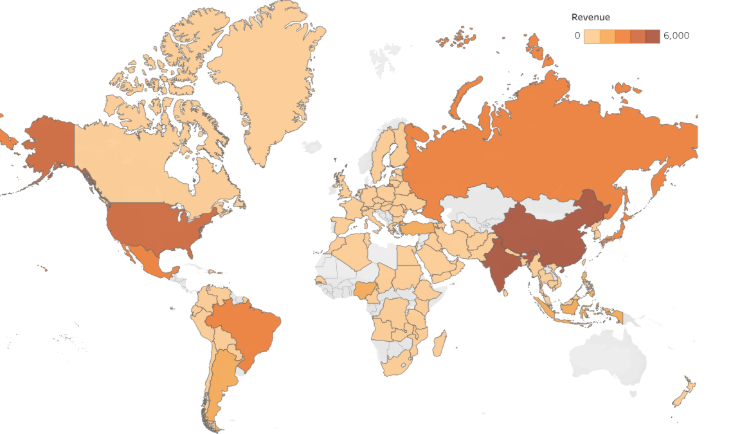
Revenue Distribution Map
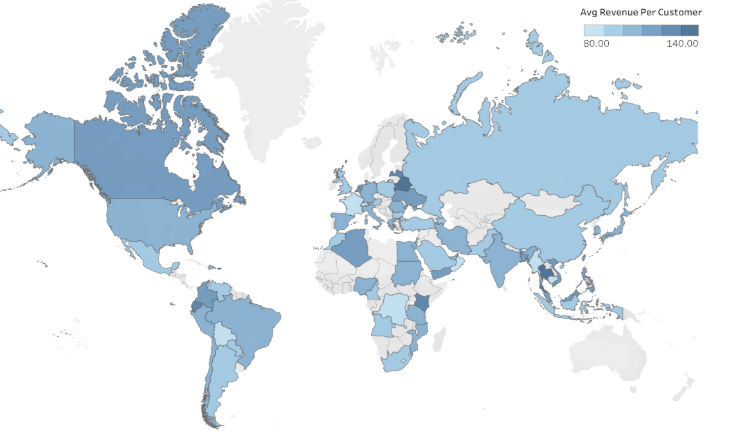
Revenue per Customer Distribution Map
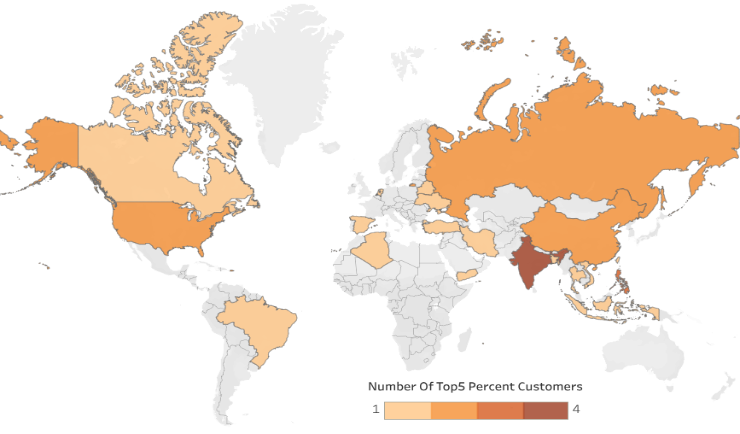
Top 5% spenders Distribution Map
The full project documentation can be found on Github Repository, including both pdf and ppt versions of the presentation.
The Dataset of this project was neither extensive nor very realistic.
One example among many: for a chain of video rentals with physical stores and customers
across 108 countries, it had just 2 stores!!!
Despite this, focusing on the fact tables payments and rentals
(typically where 'juicy' business information is stored in a database),
I was able to extract relevant insights and provide recommendations that add value
to the business.
Returning to SQL was personally satisfying, making me since then practicing on a
regular basis in platforms like StrataScratch and HackerRank, to keep my skills sharp.