Instacart Grocery Basket Analysis
1. Project Goals
Motivation
Instacart, an online grocery store that operates through an app, wants to uncover more information about their sales patterns,
with the goal of enhancing them.
Objective
Perform an Exploratory Data Analysis (EDA) of their 2017 sales data to derive insights on customers purchasing habits and
suggest strategies for better segmentation and targeted marketing.
2. Key Questions
Many business questions were raised in the beginning of the project, and several others were added during the analysis. The following deserve a highlight:
- What are the busiest days of the week and busiest hours of the day?
- Are our customers spending more at certain times of the day/week?
- Are certain types of products more popular than others, both in sales volume and revenue?
- How are our customers segmented in:
- Loyalty? (how often do they return to Instacart)
- Based on loyalty, are there differences in ordering habits (frequency and volume)?
- Same as above, but based on demographics like age, family status, income, etc.?
- Do different segments show different patterns in the types of products purchased?
3. Process
The data for this project had two sources:- “The Instacart Online Grocery Shopping Dataset 2017”, Accessed via Kaggle on 30/06/2025
- A fictional customers dataset created in the scope of Career Foundry's Data Analytics course.
Due to the nature and size of data, where the largest dataset had over 32M records,
Python was selected as the main tool for the project.
Libraries like Pandas for all dataset handling, NumPy supporting some specific computational needs,
and MatPlotlib together with Seaborn to develop the visualizations during the EDA
and later for final reporting, add to the technology package used.
All of this being managed behind by Anaconda, as library manager for Python, and using Jupyter Notebook for script development.
By specific request of the client, a final report was prepared in Excel, based on their own template.
All the scripts developed during the project are available in the Project's Github repository
Before the analysis, a careful preparation of the datasets was done taking care of all aspects of data cleaning as:
find and fix mixed datatypes; handle missing values; find and address duplicate records; identify and fix outliers in numeric fields;
remove unnecessary columns (mainly for memory optimization).
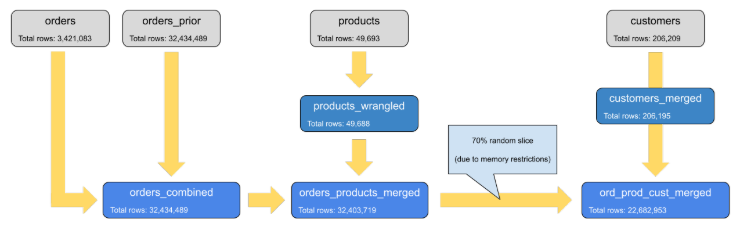
Below there is an overview of the population flow and the merging process between the datasets.
In the final stages, a random slicing was needed due to memory restrictions.
This was done using a method called seed() that ensures reproducibilty of this random selection.
4. Key Insights from Data
Distribution of orders and revenue across the day/week
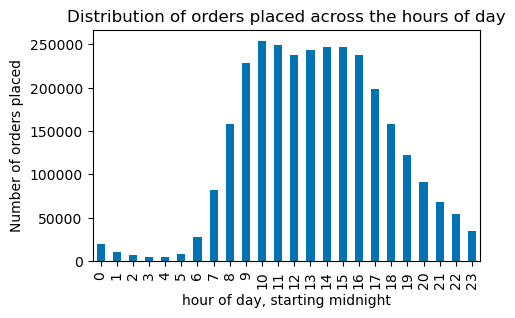
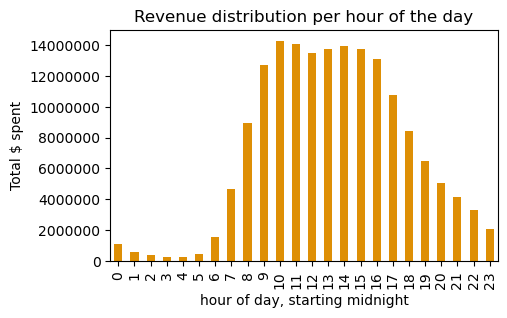
The preferred time window for our customers to place orders is between 10:00 and 16:00.
The number of orders and revenue follow the same pattern throughout the day.
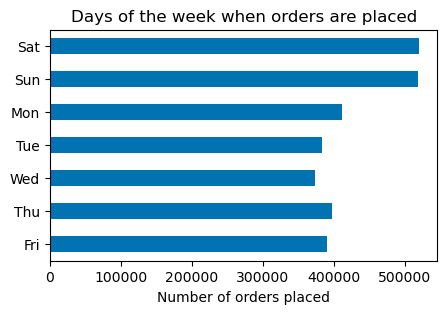
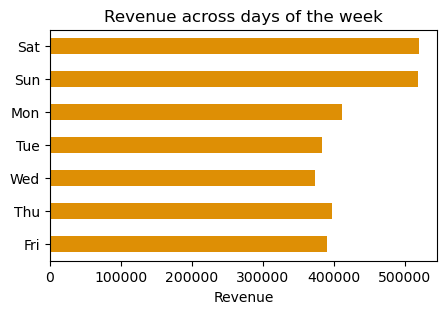
Saturday and Sunday are the preferred days to shop.
Number of orders and revenue follow the same pattern throughout the week.
Products sold and revenue across departments
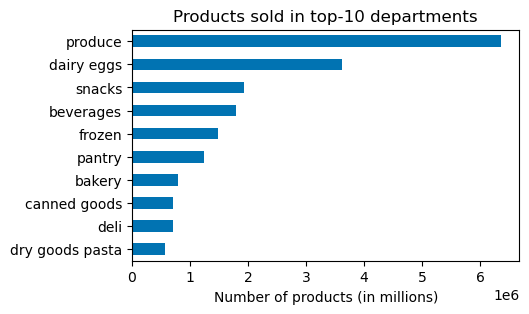
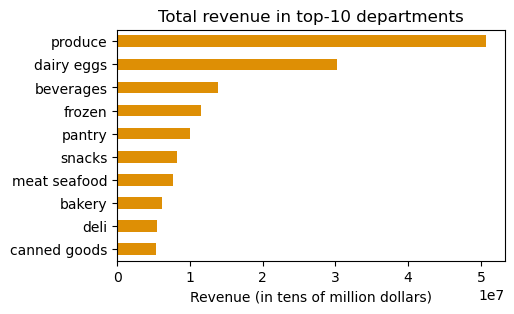
Produce and dairy eggs rank on top of both products sold and revenue.
Other departments vary, but beverages and frozen appear on top 5 in both lists.
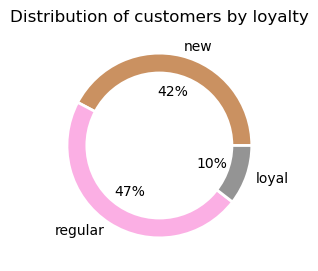
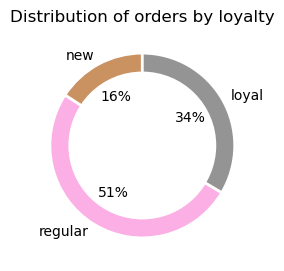
Loyalty
First off, why is customer loyalty key in retail business?Among many other benefits, if customers shop more frequently with Instacart they will:
- most likely shop way less with the competition, ensuring better overall market share
- ensures a more steady and predictable stream of income
- loyal with 40 orders or more
- regular with 10 orders or more and less than 40
- new with less than 10 orders
Ordering Behaviours
Ordering behaviours can mean several different things. Several angles were explored in the project, with and without segmentation, such as:
- most usual order day
- days in between orders
- average order cost
- total number of orders
- total spent
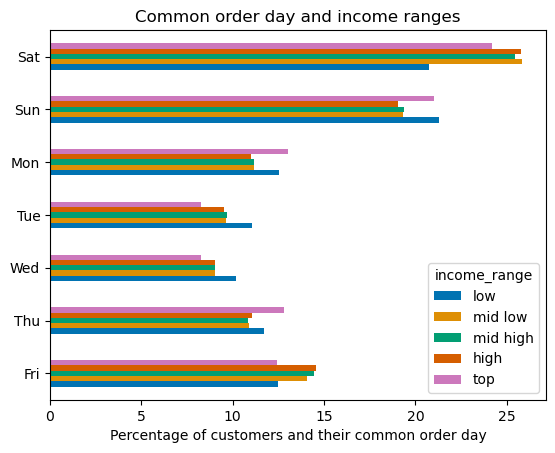
Some of the most interesting visualizations in this regard are displayed below.
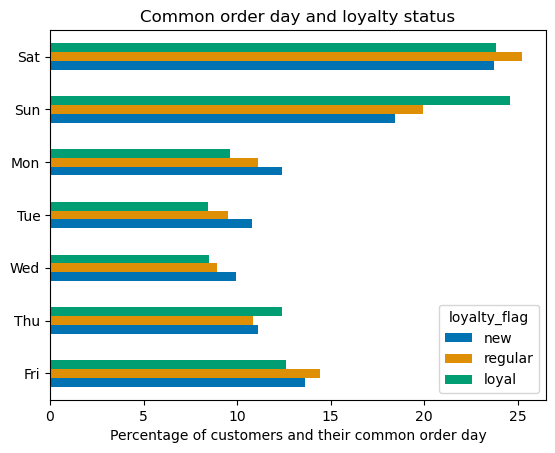
Saturday is prefered by new and regular customers, while Sunday slightly wins in loyal group
Saturday is prefered by all income groups, except low income.
The low income group spread their orders throughout the week like any other group
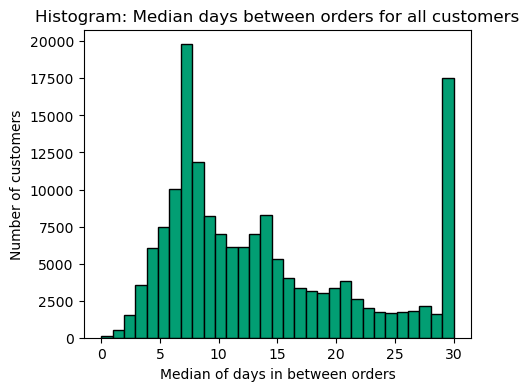
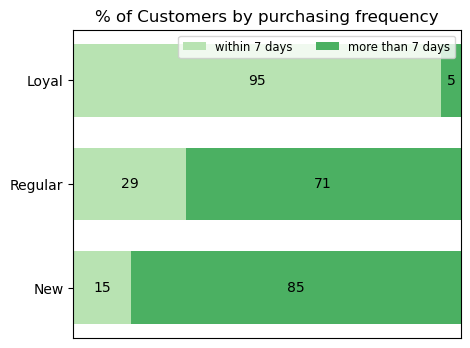
Around 12% return exactly after 7 days, with 30% shopping within 7 days or less
95% of our loyal customers return within 7 days
Regular and new are much less consistent, with only 29% and 15% respectively
5. Results
Recommendations derived from key insights to operation, sales and marketing
- Target/nudge 'regular' customers to increase loyalty base, and consequently number of orders
- Run surveys to understand what would engage 'regular/new' customers to order more (and eventually more frequently)
- Send reminders through various platforms (emails/push notifications) after an order with the promos that customers could use next time
- Ensure that these promos expire on a weekly basis, to engage customers in using them before expiry, i.e, shop weekly or sooner
- Ensure that staff on weekends is adjusted to guarantee compliance in the delivery times and customer satisfaction
- Consider performing specific discounts on Tuesdays and Wednesdays (the less busy days), especially directed for loyal and regular customers (the responsible for the largest amount of orders), to try smooth out the demand across the week
Link to download Final Report (excel)
The full project documentation can be found on Github Repository, including this final report in Excel.
Personal Reflection
Working with a totally realistic scenario and a huge dataset (over 32 million records)
was both challenging and exciting. However, the customers dataset created for the course
was found to be very artifitial (several examples that ilustrate this were noted down along
the scripts developed on the EDA phase).
Developing further my knowledge of Python, in particular in relevant libraries like Pandas,
NumPy,MatPlotlib and Seaborn, was probably the biggest personal gain from this project.
This project clearly highlighted that one learns much more by doing, and many times researching 'how to'
and adapt to one's own needs.